K-means clustering in python
INTRODUCTION
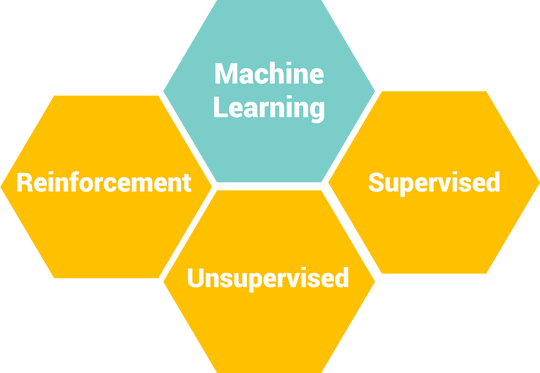
k-means clustering is a method of vector quantization . It is a type of unsupervised learning , which is used when you have unlabeled data . The goal of this algorithm is to find groups in the data, with the number of groups represented by the variable K i.e., k-means clustering aims to partition n observations into k clusters in which each observation belongs to the cluster with the nearest mean . The algorithm works iteratively to assign each data point to one of K groups based on the features that are provided . The results of theK-means clustering algorithm are as follows:
- The centroids of the K clusters that can be used to label new data
- Labels for the training data i.e., every data point gets assigned to a single cluster
ALGORITHM
The algorithm works as follows:
- First we initialize k points, called means, randomly.
- We categorize each item to its closest mean and we update the mean’s coordinates, which are the averages of the items categorized in that mean so far.
- We repeat the process for a given number of iterations and at the end, we have our clusters.
PSEUDO-CODE
The above algorithm in pseudocode:
Initialize k means with random values

For a given number of iterations:
    Iterate through items:
        Find the mean closest to the item
        Assign item to mean
        Update mean
MAIN CODE
Now,lets have a look at the code:-
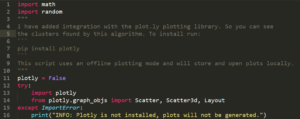
1.First import the required libraries
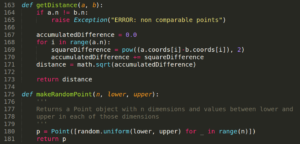
2. create a point class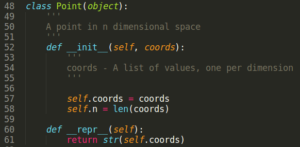 3.now, write functions for generating random points and getting distance between points as follows
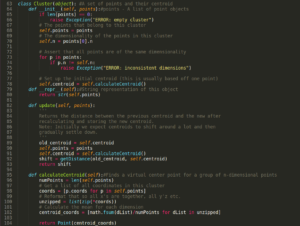
 4.Now,create a class cluster which clusters(groups) the points . it has the functions to calculate the centroid for a cluster and for updating the points in a cluster(in case , if there is a nearer centroid than the current centroid)
5.write the k-means function which keeps updating the functions iteratively till a certain cutoff is reached .
6.now, write a function to plot clusters(look at my github for this function) . For 2 and 3 dimensions the output can be visualized and can be seen on the web browser . For higher dimensions(i.e.,for dimensions>3) plots cannot be plotted but the clusters can be seen in the output
7.finally , write a main function
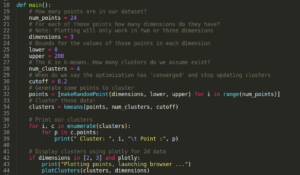 8.The output is seen as shown below
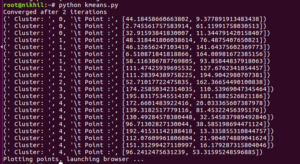
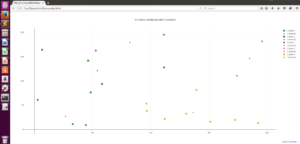
For three dimensional points also we get 3d graphs but for dimensions above 3 the output can be seen only on terminal .
It is one of the most important algorithm in machine learning
To get the whole code , please visit my github profile
Thank you
“The beautiful thing about learning is nobody can take it away from you”
1 Comment
DeepFace and Facenet for face recognition - projectsflix · July 1, 2019 at 5:35 pm
[…] check our article on k-means clustering here. […]